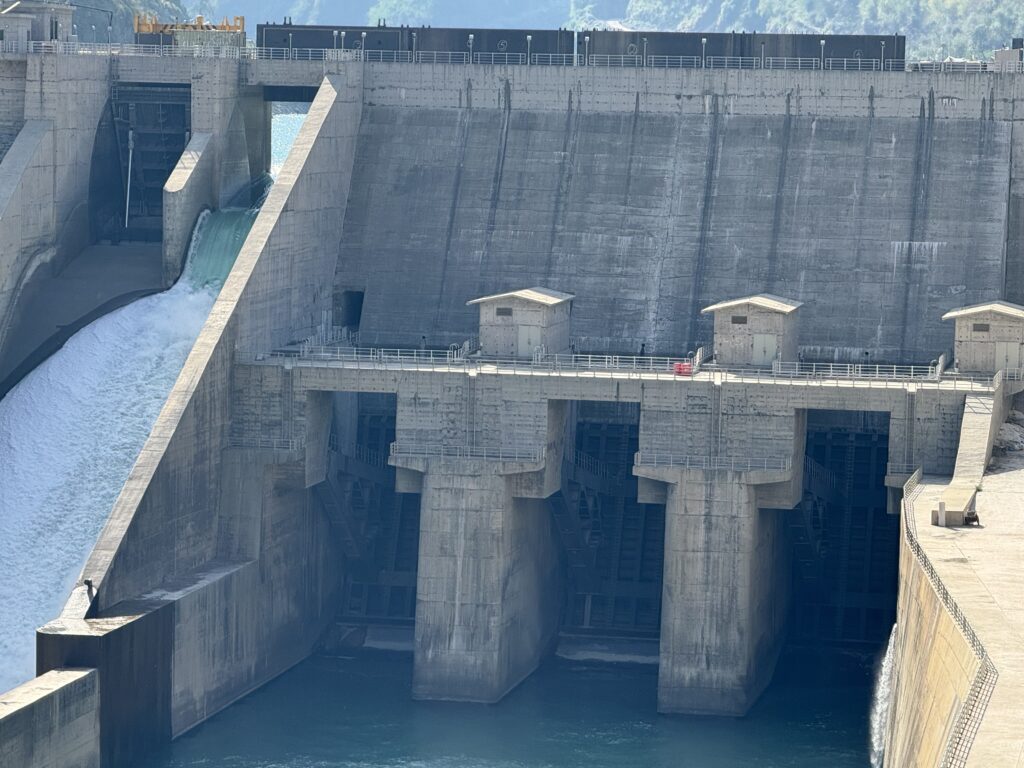
A Comprehensive 2‑D Finite Element Stability Analysis


🌊 Why Nauseri Dam Matters

Welcome, engineering professionals and seismic analysts!
Are you curious about how a towering concrete dam can resist the raw forces of nature—water pressure, uplift, hydrodynamic loads, and even the tremors of a megathrust earthquake?
Dive into this post to uncover the science behind Nauseri Dam’s 2‑D Finite Element Analysis (FEA) that guarantees structural safety for the Neelum–Jhelum Hydroelectric Project.


1️⃣ Purpose & Scope

  • What we did: Two representative sections (A along the river; B across it) were modeled in Abaqus to simulate seismic, hydrostatic, and hydrodynamic loading.
  • Why it matters: Understanding these loads ensures that downstream stability and post‑earthquake performance are within acceptable limits.

2️⃣ Material Properties – The Building Blocks of Safety

• Mass Concrete

  • Unit Weight: 23.6 kN/m³, Poisson’s Ratio: 0.15, Modulus: 25 000 MPa (peak).

Why it matters: These values guarantee that the dam structure behaves as a stiff, ductile mass of concrete.

• Rock Foundations & Interfaces

  • Rock: Weight 27 kN/m³, Poisson’s ratio 0.358, Modulus 25 850 MPa (peak).
  • Peak/Residual Strength: Friction angles 51°/31°, cohesion 0.3 MPa/0 MPa.

Interface Summary – Rock‑Concrete friction angle 42.5°, cohesion 0 MPa.


3️⃣ Numerical Modeling – Bringing the Real World Into a Virtual Domain

3.1 Geometry & Mesh

  • Section A spans riverbank piers, using plane strain elements for the concrete and foundation.
  • Section B uses varying thickness to capture cross‑stream geometry (spills in across valley).

Key Takeaway: The mesh density is optimized to capture non‑linear behavior where it matters—20 m of nonlinear rock near toe, beyond that linear elastic.

3.2 Boundary Conditions

  • Absorbing Boundaries at sides & bottom prevent wave reflection, representing semi‑infinite domain.

Why it’s important: Accurate ABCs ensure seismic waves propagate as they would in the field, avoiding artificial amplification.


4️⃣ Water Pressures – From Hydrostatic to Hydrodynamic

4.1 Hydrostatic Pressure

  • Upstream water elevation: 1015 m; downstream: 971.6 m.
  • Hydrostatic loads applied upstream/downstream of dam (Section A).

4.2 Groundwater & Spillway Pressures

  • Groundwater pressure calculated from head‑water to application point.
  • Spillway hydrostatic pressure inside the spillway passage considered.

4.3 Uplift Pressure

  • Gradient between upstream and downstream water levels; drainage coefficient 0.33 at toe drain reduces uplift by ~24 % locally.

Table: Locations A–D uplift MPa: 0.45, 0.56, 0.24, 0.13 (A‑D).


5️⃣ Seismic Load – Spectral Matching & Time Histories

5.1 Modification of Rock Time Histories

  • Spectral matching scales the PEER records to match design spectra for OBE (PGA = 0.34 g) and MCE (1.16 g).
  • RSPMATCH preserves non‑stationary features, delivering conservative time histories.

5.2 Deconvolution & Validation

  • SHAKE2000 deconvolutes motions 150 m below rock outcrop; acceleration histories applied at model bottom.
  • Validation: Propagated motion matches design motion (Figure 23), confirming consistency.

6️⃣ Numerical Results – Stability & Stress Analysis

6.1 Sliding Safety (Section A)

  • OBE: Minimum FoS = 1.2 (instantaneous).
  • MCE: Minimum FoS ≈ 0.9, but post‑earthquake factor ~3.4.

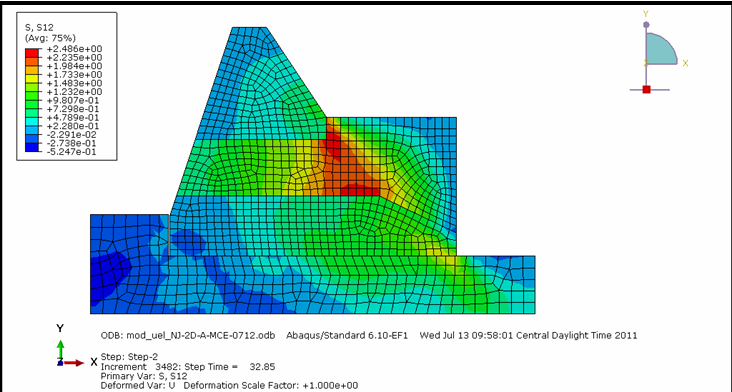
Interpretation: Dam remains stable during and after OBE; MCE causes some elastic displacement (~0.93 m) but does not lead to catastrophic sliding.

6.2 Bearing & Stress at Interfaces

  • OBE: Max bearing pressure 1.7 MPa < allowable 2.2 MPa.
  • MCE: 5.5 MPa > allowable, yet localized deformation only.

Interface Status: Under OBE, interfaces closed; under MCE, small permanent openings (≤ 2.5 cm).


7️⃣ Cross‑River Section B – Interface Behaviour

7.1 Contact Status

  • OBE: All rock‑concrete contacts remain “closed”.
  • MCE: Permanent openings up to 2.5 cm at left clay‑concrete corner; negligible impact on overall stability.

Why it matters: Even with minor interface separation, the dam’s overall stability remains intact due to high friction and zero cohesion.


8️⃣ Seismic Validation & Frequency Analysis

  • Fundamental frequencies: Section A 6.9 Hz, Section B 5.7 Hz.
  • Rayleigh damping parameters calculated using periods of interest (0.02–0.5 s) and critical damping ratios (1% for rock; 5% for dam).

9️⃣ Summary & Take‑away

  • OBE: Minimum FoS = 1.2, no sliding displacement.
  • MCE: Minimum FoS ≈ 0.9, permanent sliding ~0.93 m but post‑earthquake factor still >3 → stable.
  • Bearing Pressure: OBE 1.7 MPa (within allowable), MCE 5.5 MPa (localized deformation).
  • Cross‑River Section B: Interfaces closed under OBE; minor openings (< 2.5 cm) under MCE—no impact on stability.

🔗 Call‑to‑Action – Why Your Project Should Read This

👉 Want to dive deeper? Download the full PDF (34 pages) and explore our technical methodology in detail.


📚 Technical Glossary

TermDefinition
Factor of Safety (FoS)Ratio of resisting forces to driving forces along a potential slip plane.
Rayleigh DampingFrequency‑dependent damping using mass and stiffness coefficients α, β.
Uplift PressureHydrostatic pressure acting opposite the foundation’s weight, computed via water gradient.
Equivalent Plastic Strain (EPS)Measure of yielding in rock under seismic loads.

🚀 Closing Thought

The Nauseri Dam’s 2‑D FEA stability analysis demonstrates that even a mega‑earthquake will not lead to catastrophic sliding or failure. By understanding the underlying mechanics—material properties, interface behaviour, and wave propagation—you can appreciate how this project protects communities, ensures structural integrity, and maintains resilience in seismic zones.

Share your thoughts on how such analyses influence your design decisions!


Leave a Comment

Your email address will not be published. Required fields are marked *

Scroll to Top